
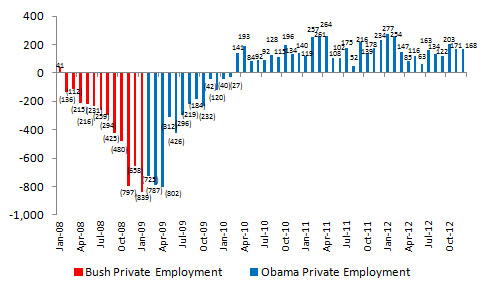
Change in Total Private Employment (in thousands), Source: U.S. Bureau of Labor Statistics
Update: Click here for the most recent jobs statistics.
After the first Friday of every month, I update the unemployment numbers so that I can compare the unemployment rate under President George W. Bush with the unemployment rate under President Obama at that time. The genesis of this ritual began when I felt compelled to respond to some left-leaning sites that were comparing Obama’s first two years and four months in office with Bush’s last and worst economic year (the above chart shows the most recent incarnation of this narrative).
In December, the private sector added a respectable 168,000 jobs in the thirty-fourth consecutive month of private sector job growth. This development is rather positive news. The country had a net employment gain of 155,000 total jobs (private and public). Moreover, 155,000 is 30,000 jobs higher than the 125,000 jobs needed each month just to keep pace with the growth of the working-age population, which is encouraging.
December is the twelfth month in which the overall number of jobs lost/gained during the Obama administration is better than the number lost during the Bush administration. It is also the eighth month since the number of net private sector jobs gained or lost during the Obama administration turned positive. That said, the unemployment rate is still five-tenths of a percentage point worse today than it was during President Bush’s last full month in office, but it is the same rate it was when President Obama first entered office. In other words, the unemployment rate in all 48 months of Obama’s presidency has been higher than that of any single full month in President Bush’s 8 years in office.
The seasonally adjusted unemployment rate remained unchanged at 7.8% — the lowest month of unemployment during the Obama presidency. This number remains five-tenths of a percentage point higher than President Bush’s last full month in office in December 2008. However, it marks the fourth consecutive month in which the unemployment rate has been lower than 8% after a string of 43 consecutive months during the 48-month Obama presidency in which unemployment had been 8% or higher.
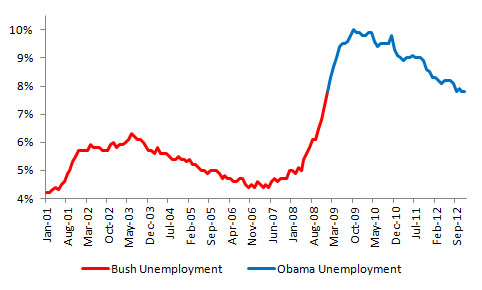
Unemployment Rate, Source: U.S. Bureau of Labor Statistics
That said, the unemployment rate only accounts for the percentage of the unemployed who are actively seeking employment. It does not include people who have given up on finding jobs. The month ended with 28,000 more people employed at the end of December than were employed at the end of November. The discrepancy between the change in the number of people employed and nonfarm payrolls stems from the fact that households report the employment number, while businesses report nonfarm employment.
The civilian labor force increased faster than the number of new employees entering the work force increased. Therefore, the main reason the unemployment rate was flat is that the numerator (the number of unemployed Americans) in the unemployment equation decreased by a smaller percentage than the denominator increased (the civilian labor force). Put simply, the unemployment rate remained unchanged because the number of people in the labor force increased more than the number of people employed increased. This development is not a positive one, but seems consistent with a policy regime driven by entitlement growth rather than by economic growth.
The civilian labor force ended December at 155.5 million vs. November’s 155.3 million. 143.3 million people had jobs in December, which was an increase of about 28,000 people from November versus about 192,000 people who entered the labor force.
Both the Bush and Obama presidencies have been marked by a steady decline in the labor force participation rate. The labor force participation rate measures the number of people in the labor force as a percentage of the total working-age population. The labor force participation rate remained unchanged from 63.6% in November.

Labor Force Participation Rate, Source: U.S. Bureau of Labor Statistics
Putting the Numbers into Perspective
The employment statistics during President Bush’s period in office continue to look better than those under President Obama’s to date if one puts more emphasis on the overall unemployment rate. However, President Obama’s employment statistics seem better if one looks at total private sector employment. Over President Bush’s tenure, the private sector lost a net 646,000 jobs, assuming that he gets credit for all jobs lost in January 2009 and none for those lost in January 2001. I changed my methodology in response to a left-leaning blogger‘s fair point “that CES estimates represent information reported by survey respondents for their pay periods that include the 12th of the month.” Hence, any subsequent numbers for jobs created near the end of January would likely appear in the February numbers.
If one attributes the first 19 days of January 2009’s job losses to Bush, and the remaining 11 days of job losses to Obama, the private sector shed 339,000 jobs during the Bush administration (the private sector gained a net 147,000 jobs if one attributes all of January 2009’s job numbers to Obama, and all of January 2001’s numbers to Bush). Surprisingly, this number includes the 3.78 million private sector jobs lost in 2008, and an additional 839,000 in 2009 (514,000 if one attributes the first 19 days of January 2009’s job losses to Bush).
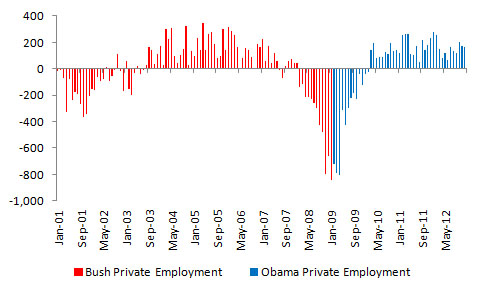
Change in Total Private Employment (in thousands), Source: U.S. Bureau of Labor Statistics
In contrast, under President Obama’s administration, the private sector has gained a net 1.11 million private sector jobs (a gain of 786,000 if one attributes the remaining 11 days of job losses in January 2009 to Obama, and a gain of 272,000 if one attributes all of January 2009’s losses to him).
Again, the point of this argument is not to assess blame on either administrations’ policy. It simply puts the numbers into perspective.
For each job the private sector cut under George W. Bush, the private sector gained~1.7 jobs under Barack Obama (if one attributes January 2009’s job losses to Obama, the private sector added ~1.9 jobs for every job it created under Bush). The economy would need to destroy 1.76 million private sector jobs for Bush to break even with Obama (not accounting for the 125,000 jobs that the economy must create each month just to keep pace with population growth).
While President Obama has surpassed President Bush on private sector job creation, the unemployment rate has remained persistently high. It will likely continue to remain so as more people enter the labor force as the economy improves, even if the private sector continues to add jobs at similar rates. Nevertheless, the country still has a long way to go to restoring full employment.


Pingback: Bush vs. Obama: Unemployment (November 2012 Jobs Data) | Reflections of a Rational Republican
Pingback: Bush vs. Obama: Unemployment (October 2012 Jobs Data) | Reflections of a Rational Republican
Pingback: Bush vs. Obama: Unemployment (September 2012 Jobs Data) | Reflections of a Rational Republican
Pingback: Bush vs. Obama: Unemployment (August 2012 Jobs Data) | Reflections of a Rational Republican
Pingback: Bush vs. Obama: Unemployment (July 2012 Jobs Data) | Reflections of a Rational Republican
Pingback: Bush vs. Obama: Unemployment (June 2012 Jobs Data) | Reflections of a Rational Republican
Pingback: Bush vs. Obama: Unemployment (May 2012 Jobs Data) | Reflections of a Rational Republican
Pingback: Bush vs. Obama: Unemployment (April 2012 Jobs Data) | Reflections of a Rational Republican
Pingback: Bush vs. Obama: Unemployment (March 2012 Jobs Data) | Reflections of a Rational Republican
Pingback: Bush vs. Obama: Unemployment (February 2012 Jobs Data) | Reflections of a Rational Republican
Pingback: Bush vs. Obama: Unemployment (January 2012 Jobs Data) | Reflections of a Rational Republican
Pingback: Bush vs. Obama: Unemployment (December 2011 Jobs Data) | Reflections of a Rational Republican
Pingback: Bush vs. Obama: Unemployment (November 2011 Jobs Data) | Reflections of a Rational Republican
Pingback: Bush vs. Obama: Unemployment (October 2011 Jobs Data) | Reflections of a Rational Republican
Pingback: Bush vs. Obama: Unemployment (September 2011 Jobs Data) | Reflections of a Rational Republican
Pingback: Bush vs. Obama: Unemployment (August 2011 Jobs Data) | Reflections of a Rational Republican
Pingback: Bush vs. Obama: Unemployment (July 2011 Jobs Data) | Reflections of a Rational Republican
Pingback: Bush vs. Obama: Unemployment (June 2011 Jobs Data) | Reflections of a Rational Republican
Pingback: Bush vs. Obama: Unemployment (May 2011 Jobs Data) | Reflections of a Rational Republican
Pingback: Bush vs. Obama: Unemployment | Reflections of a Rational Republican
Pingback: Bush vs. Obama: Total Private Sector Employment | Reflections of a Rational Republican
“This number remains five-tenths of a percentage point higher than President Bush’s last full month in office in December 2008. ”
Since the reference week is the 12th, the January 2009 unemployment rate would be President Bush’s last full month, December 12th, 2008 through January 12th, 2009. Bush’s last day in office was January 20th, 2009. Some people believe the president leaves office on the first day of the new year, but they forget that inauguration does not happen until the 20th.
“Since the reference week is the 12th, the January 2009 unemployment rate would be President Bush’s last full month, December 12th, 2008 through January 12th, 2009. Bush’s last day in office was January 20th, 2009. Some people believe the president leaves office on the first day of the new year, but they forget that inauguration does not happen until the 20th.”
Henry, by Bush’s last full month, I mean the last month in which he occupied the oval office from the beginning of the first day to the last day of the month. President Bush did not occupy the oval office for the last 11 days of January. Hence, January is not his last full month. That said, you’ll notice that I calculate and compare these numbers using three different methodologies, the dominant one of which is ascribing Bush’s numbers to January 2009.
“In other words, the unemployment rate in all 48 months of Obama’s presidency has been higher than that of any single full month in President Bush’s 8 years in office.”
In the same paragaph that is using the full methodology, it counts 48 months for Obama’s Presidency. It has only been 46 months, February would be the first full month.
Your prediction that the unemployment rate will remain high under Obama is now officially wrong.