

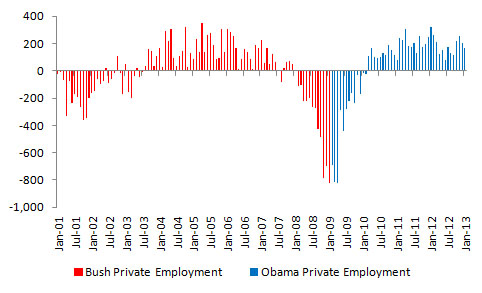
Change in Total Private Employment (in thousands), Source: U.S. Bureau of Labor Statistics
After the first Friday of every month, I update the unemployment numbers so that I can compare the unemployment rate under President George W. Bush with the unemployment rate under President Obama at that time. The genesis of this ritual began when I felt compelled to respond to some left-leaning sites that were comparing Obama’s first two years and four months in office with Bush’s last and worst economic year (the above chart shows the most recent incarnation of this narrative).
In January, the private sector added a respectable 166,000 jobs in the thirty-fifth consecutive month of private sector job growth. This development is rather positive news. The country had a net employment gain of 157,000 total jobs (private and public). Moreover, 157,000 is 32,000 jobs higher than the 125,000 jobs needed each month just to keep pace with the growth of the working-age population, which is encouraging.
December is the thirteenth month in which the overall number of jobs lost/gained during the Obama administration is better than the number lost during the Bush administration. It is also the ninth month since the number of net private sector jobs gained or lost during the Obama administration turned positive. That said, the unemployment rate is still six-tenths of a percentage point worse today than it was during President Bush’s last full month in office, but it is the same rate it was when President Obama first entered office. In other words, the unemployment rate in all 49 months of Obama’s presidency has been higher than that of any single full month in President Bush’s 8 years in office.
The seasonally adjusted unemployment rate increased by one-tenth of a percentage point to 7.9% — the fifth lowest month of unemployment during the Obama presidency. This number remains six-tenths of a percentage point higher than President Bush’s last full month in office in December 2008. However, it marks the fifth consecutive month in which the unemployment rate has been lower than 8% after a string of 43 consecutive months during the 49-month Obama presidency in which unemployment had been 8% or higher.

Unemployment Rate, Source: U.S. Bureau of Labor Statistics
That said, the unemployment rate only accounts for the percentage of the unemployed who are actively seeking employment. It does not include people who have given up on finding jobs. The month ended with 17,000 more people employed at the end of January than were employed at the end of December. The discrepancy between the change in the number of people employed and nonfarm payrolls stems from the fact that households report the employment number, while businesses report nonfarm employment.
The civilian labor force increased faster than the number of new employees entering the work force increased. Therefore, the main reason the unemployment rate increased is that the numerator (the number of unemployed Americans) in the unemployment equation decreased by a smaller percentage than the denominator increased (the civilian labor force). Put simply, the unemployment rate remained unchanged because the number of people in the labor force increased more than the number of people employed increased. This development is not a positive one, but seems consistent with a policy regime driven by entitlement growth rather than by economic growth.
The civilian labor force ended January at 155.7 million vs. December’s 155.5 million. 143.3 million people had jobs in January, which was an increase of about 17,000 people from December versus about 143,000 people who entered the labor force.
Both the Bush and Obama presidencies have been marked by a steady decline in the labor force participation rate. The labor force participation rate measures the number of people in the labor force as a percentage of the total working-age population. The labor force participation rate remained unchanged from 63.6% in December.

Labor Force Participation Rate, Source: U.S. Bureau of Labor Statistics
Putting the Numbers into Perspective
The employment statistics during President Bush’s period in office continue to look better than those under President Obama’s to date if one puts more emphasis on the overall unemployment rate. However, President Obama’s employment statistics seem better if one looks at total private sector employment. Over President Bush’s tenure, the private sector lost a net 665,000 jobs, assuming that he gets credit for all jobs lost in January 2009 and none for those lost in January 2001. I changed my methodology in response to a left-leaning blogger‘s fair point “that CES estimates represent information reported by survey respondents for their pay periods that include the 12th of the month.” Hence, any subsequent numbers for jobs created near the end of January would likely appear in the February numbers.
If one attributes the first 19 days of January 2009’s job losses to Bush, and the remaining 11 days of job losses to Obama, the private sector shed 372,000 jobs during the Bush administration (the private sector gained a net 93,000 jobs if one attributes all of January 2009’s job numbers to Obama, and all of January 2001’s numbers to Bush). Surprisingly, this number includes the 3.80 million private sector jobs lost in 2008, and an additional 821,000 in 2009 (503,000 if one attributes the first 19 days of January 2009’s job losses to Bush).
Change in Total Private Employment (in thousands), Source: U.S. Bureau of Labor Statistics
In contrast, under President Obama’s administration, the private sector has gained a net 1.91 million private sector jobs (a gain of 1.60 million if one attributes the remaining 11 days of job losses in January 2009 to Obama, and a gain of 1.09 million if one attributes all of January 2009’s losses to him).
Again, the point of this argument is not to assess blame on either administrations’ policy. It simply puts the numbers into perspective.
For each job the private sector cut under George W. Bush, the private sector gained~2.9 jobs under Barack Obama (if one attributes January 2009’s job losses to Obama, the private sector added ~11.7 jobs for every job it created under Bush). The economy would need to destroy 2.58 million private sector jobs for Bush to break even with Obama (not accounting for the 125,000 jobs that the economy must create each month just to keep pace with population growth).
While President Obama has surpassed President Bush on private sector job creation, the unemployment rate has remained persistently high. It will likely continue to remain so as more people enter the labor force as the economy improves, even if the private sector continues to add jobs at similar rates. Nevertheless, the country still has a long way to go to restoring full employment.

You can purchase my first complete anthology at Amazon or Smashwords. It includes ten stories about cursed alien artifacts, interstellar investment banking, ancient alien astronauts, parallel timelines, alien experimentation, and space colonization gone horribly wrong.
First published in venues like Fictionvale Magazine, NewMyths.com, Mad Scientist Journal, Plasma Frequency Magazine, Outposts of Beyond, and The Colored Lens, several of these stories have received Honorable Mentions in the prestigious Writers of the Future Contest.


Pingback: Bush vs. Obama: Unemployment (November 2012 Jobs Data) | Reflections of a Rational Republican
Pingback: Bush vs. Obama: Unemployment (December 2012 Jobs Data) | Reflections of a Rational Republican
Pingback: Bush vs. Obama: Unemployment (October 2012 Jobs Data) | Reflections of a Rational Republican
Pingback: Bush vs. Obama: Unemployment (September 2012 Jobs Data) | Reflections of a Rational Republican
Pingback: Bush vs. Obama: Unemployment (August 2012 Jobs Data) | Reflections of a Rational Republican
Pingback: Bush vs. Obama: Unemployment (July 2012 Jobs Data) | Reflections of a Rational Republican
Pingback: Bush vs. Obama: Unemployment (June 2012 Jobs Data) | Reflections of a Rational Republican
Pingback: Bush vs. Obama: Unemployment (May 2012 Jobs Data) | Reflections of a Rational Republican
Pingback: Bush vs. Obama: Unemployment (April 2012 Jobs Data) | Reflections of a Rational Republican
Pingback: Bush vs. Obama: Unemployment (March 2012 Jobs Data) | Reflections of a Rational Republican
Pingback: Bush vs. Obama: Unemployment (February 2012 Jobs Data) | Reflections of a Rational Republican
Pingback: Bush vs. Obama: Unemployment (January 2012 Jobs Data) | Reflections of a Rational Republican
Pingback: Bush vs. Obama: Unemployment (December 2011 Jobs Data) | Reflections of a Rational Republican
Pingback: Bush vs. Obama: Unemployment (October 2011 Jobs Data) | Reflections of a Rational Republican
Pingback: Bush vs. Obama: Unemployment (September 2011 Jobs Data) | Reflections of a Rational Republican
Pingback: Bush vs. Obama: Unemployment (August 2011 Jobs Data) | Reflections of a Rational Republican
Pingback: Bush vs. Obama: Unemployment (July 2011 Jobs Data) | Reflections of a Rational Republican
Pingback: Bush vs. Obama: Unemployment (June 2011 Jobs Data) | Reflections of a Rational Republican
Pingback: Bush vs. Obama: Unemployment (May 2011 Jobs Data) | Reflections of a Rational Republican
Pingback: Bush vs. Obama: Unemployment | Reflections of a Rational Republican
Pingback: Bush vs. Obama: Total Private Sector Employment | Reflections of a Rational Republican
Reblogged this on catherinephung.
In other words, the unemployment rate in all 49 months of Obama’s presidency has been higher than that of any single full month in President Bush’s 8 years in office.
Obama has not been in office 49 months.
January 19th to February 19th would be 49 months.
Yes, that would be 49 “full” months, but that was not what I wrote.
The Obama administration has occupied the Oval Office since January 2009 and then a total of 49 employment reports have been issued.
You are arguing over semantics and I’m not sure what you are trying to achieve with your point.
January 2009 was not for Obama’s administration. The survey is for the week of January 12th, 2009, during the Bush administration. Obama’s administration started on January 19th, 2009.
Huh?
2009 – 2012 = 4×12 = 48
January 2013 = 1
1+48 = 49.
I must say it is refreshing to see a somewhat intellectually honest approach to this comparison coming from someone who leans right. The web is full of false comparisons to Reagan and Bush that are structured by both sides to achieve an outcome. My only question, which I am sure you have responded to before, but please let me ask it, is why you start with January 2009 for President Obama (and the same methodology for President Bush), when none of their policies had been enacted. I am sure that any starting date for a presidency’s impact on the economy would be arbitrary, but why not do a comparison that begins three months into the first term, or six months, or even a year? In my humble opinion, any of these would be more accurate representation of their job impact than starting with the day the President takes office when the prior administration’s policies are still in full force. The same, by the way, goes for spending figures, but that is another comparison for you to take on in a separate blog!
I understand that you are presenting the numbers with your point about Obama’s numbers being higher in his 49 months than in Bush’s administration, but you fail to take into account the fact that a new president cannot suddenly, magically stop a ripple effect. If a snowball is rolling down a hill, it will keep getting bigger and bigger, and a new president standing in front of it will not immediately stop the growth of the snowball. In terms of unemployment, once the rates start going up, a new president cannot stop it. Obama got caught in the middle of the ripple effect, and somehow he is given fault for something that Bush started?
It’s now been five years and the labor participation rate is at its lowest since the late 70s, and somehow it’s still Bush’s fault?
Just how many years does it take for President Obama to accept his share of the blame?
The main thing you’re missing here is BIPARTISAN! Democrats did not sabotage the country just because they didn’t like Bush, however that’s exactly what Republican’s are doing to Obama. Anything that’s good for the country that Obama tries to implement is immediately shot down by the Republican’s because they want to make him look like the worst President ever. I think it’s pretty sad that the Republicans had only one goal for the President’s first term, and they couldn’t even achieve that. The GOP said their only goal was to make Obama a one-term President. They had four years to accomplish that goal, and they lost by a landslide.
what about now? Under President Obama’s, the unemployment rate has now decreased to 5.6 percent, the lowest it’s been since 2007, I guess you don’t remember when the US was losing 77k jobs a month under Bush. The economy has risen 4% in the last 2 quaters which is huge. There have been 63 straight months of economic expansion and more than two solid years of manufacturing expansion. Forbes (not a site friendly to liberals ) just released an artice that claims that “President Obama’s administration has outperformed President Reagan’s in all commonly watched categories” They forecast that unemployment will fall to around 5.4% by summer, 2015 (again Dec 14 shows it at 5.6%. On the last days of Clinton the Dow was under 10,000 pts, when Bush was done with it it was under 8,000 points. Look at the Dow today..its over 17,000 pts, more than double… Obama is the worst Socialist ever.
This is the best private sector jobs creation performance in American History.
Pingback: News: Reid and Democratic Lies on the Economy | Pitts Report
HOW CONVENIENT you leave out the number one factor in labor Force participation- THE RETIRING BABY BOOMERS. how could you forget that.You didnt, you intentionally left it out.Also there are more people attending college now, which takes them out of the work force.
The last 50 years Democrats have created some 48-50 millin jobs compared to 24 million by Republicans.
Here are some facts, sorry the charts i could not copy to this discussion, but they are explained.
Also how could you leave out the 2008 manufacturing jobs armageddon?I know it helps your case to leave out the worst recession since the Great Depression, but that does not fly.Obama has brought back these jobs from what he was handed, comparing the 2007 numbers is intellectually dishonest, he was handed a shitstorm when he took office.
“Let’s talk about labor-force participation.
No, really.
For decades, this number slumbered quietly in the depths of the monthly jobs report from the US Bureau of Labor Statistics (BLS). Nobody paid it much attention. But of late—and particularly in the run-up to today’s Congressional election—it has become a key talking point for critics of president Barack Obama’s economic policies.
The chart does indeed look pretty ugly, with a decline since the late 1990s that becomes especially striking in the late 2000s. In econometric circles this is what’s known as a “frowny face.”
Actually that was a joke. It’s not really called a frowny face. But it might as well be. In September, the US labor participation rate fell to 62.7%, the lowest since the US economic malaise under president Jimmy Carter in the late 1970s.
That looks pretty bad. But to understand why this number is important, you have to understand what people think it says—and what it actually says.
Critics of Obama think it shows that his supposedly liberal policies are damaging the economy and prompting Americans to drop out of the job market en masse. They think it shows the Democratic neo-welfare state this president constructed is rewarding laziness by doling out government handouts. They think it somehow shows that the sharp decline in the US unemployment rate is a fraud.
But it doesn’t show these things. All it shows is that the labor force—the number of people either employed or “actively looking for work”—is a shrinking share of the US population. In absolute terms, the labor force could be shrinking, or it could just be growing more slowly than the population as a whole. So which is it?
Well, as the first of these small charts shows, the civilian population—that is to say, over-16s who aren’t in institutions such as prison or on active military duty—is growing at much the same rate as always. It reached 248.5 million in September, up roughly 1% from a year ago.
The second chart is the civilian labor force, going back to the late 1970s. It’s still growing, but growth has flattened out quite a bit over the last five years. Correspondingly (third chart), the number of people alive but not in the labor force is rising at an accelerating pace.
Why is this? The non-partisan Congressional Budget Office (CBO) suggests that there’s a pretty clear reason. “An unusually large number of people have stopped looking for work,” CBO analysts wrote in a broad-based analysis of the labor market published back in February (pdf).
So that means the critics of the administration are right, and people are dropping out of the labor force at an unprecedented pace? Not so fast. A lot of the people dropping out of the labor force are just, well, old. That’s because the demographic bulge known as the baby boom generation is aging out of the workforce.
You see this in the fourth chart, showing a sharp surge in people over 65 who are out of the labor force. There are roughly 37 million of them, and more than 50 million who are over 55.
The cumulative effect of all these people aging out of the work force is to lower the participation rate. The CBO says that roughly half of the three-percentage-point decline in labor-force participation since the end of 2007 is due to the aging of the workforce. (For the record, it’s not just the CBO. A range of other papers—here, here, and here for example—have come up with similar results. Of course, not everybody agrees.)
How the other half lives
So if half the fall in labor-force participation since the recession is demographic, what about the other half? Well, one percentage point of the decline is related to temporary factors related to the business cycle, the CBO says. That leaves half a percentage point to account for.
This is where the critics of Obama—to the extent that he actually is responsible for the slow pace of recovery—might appear to have a legitimate point. Some folks do appear to have dropped out of the workforce all together. The BLS counts a category of people called discouraged workers (fifth chart)—those who haven’t looked for a job in the past four weeks, specifically because they believe there aren’t any jobs for them. Even though they want work, these people aren’t counted as part of the labor force because they’re not actively looking.
And, indeed, years into the economic recovery, the number of discouraged workers remains high. This is related to “unusual aspects of the slow recovery that led workers to become discouraged and permanently drop out of the labor force,” wrote the CBO.
However, this may not be all that surprising, given the depth of the recession, which was preceded by the worst financial panic in nearly a century. And since 2010 the number of discouraged workers has been declining, a sign that the ongoing improvement in the economy is beginning to coax more workers back into employment.
Here’s another sign of that. Let’s look at the employment-to-population ratio. This is simply the share of the civilian population who have jobs. (As a reminder, labor-force participation is the share of the population who have jobs or are actively looking.) If you look at the overall data—the sixth chart—the falloff looks pretty drastic and the recovery pretty anemic.
But now let’s look at the same data, but confine it to just people in their prime working years, aged 25 to 54—the seventh chart. This helps us strip out the surging ranks of older baby-boomers. It also strips out the ranks of those between the ages of 16 and 24, where increasing college attendance has been decreasing employment participation fairly steadily for at least 15 years. Both those groups can skew the numbers.
So when you look at this prime working-age population, you can see that, after the sharp collapse back in 2008, things have been improving steadily over the last few years, though there’s clearly still a way to go.
The wrong number to use anyway
Now, even if the US economy continues improving—as most expect—it doesn’t mean that labor-force participation will rebound. Rather, it’s likely to keep declining for at least the next 10 years, as the baby-boomers continue to age out of the workforce. (CBO estimates that labor force participation will be at 60.8% in 2024.)
Without another giant baby boom, it will most likely never to return to the peaks seen during the late 1990s, no matter what political party is in charge. As a measure of whether Americans who should be working are working, the employment-to-population ratio for people of prime working age is much more useful.
In other words, you should stop talking about labor-force participation. After all, Obama’s conservative critics will do just that if one of their own takes over the White House in 2016.”